- To physiologically evaluate how long it takes for food (meal) and/or liquid to pass through the stomach
- Define the time it takes to digest 50% of the radioactive meal/liquid
- Nuclear medicine is an excellent exam to determine and quantify this data
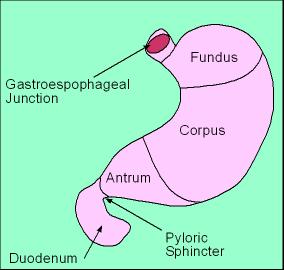
- Refer to the above diagram for stomach anatomy
- Proximal end of the stomach contains the fundus and is considered a large reservoir where it can accept large volumes of liquid with only a slight increase in pressure
- Regular slow muscular contraction of the fundus produces pressure gradients which moves liquid and solid materials towards the distal end of the stomach and duodenum
- Fundus contraction is the main mechanism that causes liquid to empty
- It is also volume dependent
- The greater the amount of liquid, the more rapid it will empty
- If analyzed as a time-activity curve an exponential slope would be seen where the slope increases as the amount of fluid increases
- Nutrients, salts, and acidity of the liquid tend to slow the emptying process
- The distal portion or the antrum mainly works on solid materials (food)
- It grinds and regulates solid food emptying
- Contraction is in a ring-like pattern
- Food is broken down into smaller particles and has to be ≤ 1 to 2 mm in size before it is allowed to pass into the duodenum
- Larger particles are repelled at the pyloric sphincter and continue to be broken down before it can pass into the small intestine
- Following the intake of solid food there is an initial lag time before material starts to empty from the stomach, then once it starts to empty it will do so in a linear fashion, if displayed as a time-activity curve (unlike liquid that is exponential)
- Note the above diagram
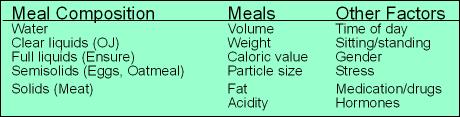
- Under meal composition, water empties the fastest and each component below it empties at a slower rate, with solid (meat) taking the longest
- Meal composition also effects emptying and their many factors are listed above
- In addition, there are other factors that will affect emptying process
- It is important to also realize that hormones and neurological activity also effect emptying time (other factors)
- The proximal 1/3 of the stomach is neurologically silent
- However, the lower 2/3 of the stomach undergo electrical impulses that causes gastric contraction
- Many hormones affect gastric contraction, however, the relationship between neurological activity and hormone excretion is not clearly understood
- Mechanical reduction of gastric emptying include, but not limited to: tumors, obstruction, radiation therapy
- Functional reasons for reduced gastric emptying include, but are not limited to
- Acute: trauma, gastroenteritis, hyperalimentation, physiological, drugs, and hormones
- Chronic: Diabetes mellitus (usually why we do this study), hypothyroidism, progressive sclerosis, etc.
- Increased emptying time can be caused by: postoperatively, diseases (duodenal ulcer, hyperthyroidism), hormones (thyroxine, motilin, entergastrone), drugs (metoclopramide, domperidone, cisapride, erythromycin)
- There are numerous methods to this approach
- Perhaps the most unusual approach was done back in 1976 where a chicken was injected with Tc99m Sulfur Colloid, sacrificed, the liver removed, cooked, and then mixed with beef or chicken stew
- More realistic approaches
- Injecting chicken or beef liver with Tc99m Sulfur Colloid, microwaving the liver and then mixing it with beef stew
- Injecting eggs with Tc99mSulfur Colloid, microwaving the meal
- Injecting instant oatmeal with Tc99mSulfur Colloid and microwaving the meal
- Some clinics will serve radio-eggs or radio-oatmeal with bread (and jelly), milk or water, as a complete breakfast
- And there are many other approaches
- Whatever approach is used, consider the following
- Always use the same approach
- Consider the meal content (caloric, solid vs. liquid)
- Your approach should be based on some form of published clinical data
- Positioning
- Personnel preference based on equipment available
- My suggestion, based on a two-headed camera system, if the patient can be imaged upright, then this would be the method of choice, taking both anterior and posterior images at the same time
- Image acquisition and correction for decay
- Following the administration of a radioactive meal, preferably solid, ANT and POST images are taken immediately after the patient has eaten
- Initial images are labeled as zero time
- Regions of interest are drawn over the stomach in both images and the counts are recorded
- ANT counts and POST counts are used to determine the geometric mean using the above diagram
- As an example, lets say that ANT counts = 20,500 and POST counts = 21,500.
- Applying the geometric mean formula would give you a value at time zero of 21,994 counts
- Lag phase - This is the time in which the radioactive meal is still in the stomach, but has not started to empty into the small bowel. There may or may not be some correlation between delayed emptying and a delayed lag phase.
- Images are then taken every 30 minutes for up to 2.5 hours
- ROIs are then drawn over the ANT and POST stomach and counts are recorded
- Using the above diagram, again determine the geometric mean for each set of images taken
- These counts must then be relate (decayed) back to time zero
- How is this done?
- It is important to realize that you must decay back to the past, to time zero, which means you have to divide geometric mean by the appropriate decay factor
- Several clinics have known to multiple the geometric mean by the decay factor Dont Do This!
- Applying the correct approach the geometric mean is calculated and then the decay factor is applied
- Notice from the formula that the technetium decay factor is divided into the geometric mean, which allows you to relate the time in which the images where taken back to zero time
- As an example, if you have a geometric mean of 10,000 counts and an hour has passed from time zero, then the decay factor is 0.891
- The one hour decay factor is then divided into 10,000 counts giving you a value of 11,223 counts
- Now you need to determine the gastric emptying time at 1 hour
- Using the examples given above and noting the diagram, you must divide 11,223 counts into 21,994 counts and then multiple by 100
- This value is 51%, which means that this is the amount of the radiomeal that remains in the stomach
- To determine the amount emptied apply the above example
- Hence, 100% - 51% = 49% emptied
- For each ANT/POST counts collected you must determine what the % emptying is by applying the above examples for each time collected
![]()
![]()


![]()
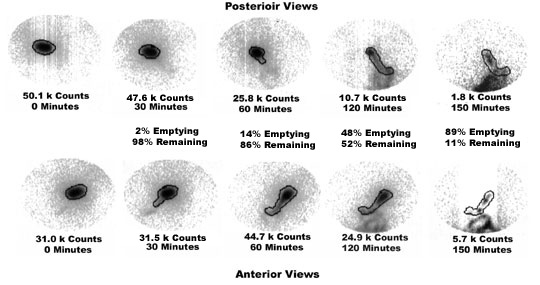
- The above images show images and ROIs from a procedure in which a patient consumed 855 μCi of Radio Colloid eggs. Images were taken immediately after the meal was eaten and then every ½ hour for 2.5 hours
- Not all images are displayed, however, appropriate data is displayed as a sample study
- The above identifies how the % Remaining/Emptying times were calculated
- Only 1/2 hour intervals are displayed
- Lag time is significant
- Based on incomplete data (need a 90 minute data) the emptying appears abnormal
- Normal T1/2 range is usually between 50 to 90 minutes
- This is an example of an abnormal study since normal emptying should be between 50 to 90 minutes
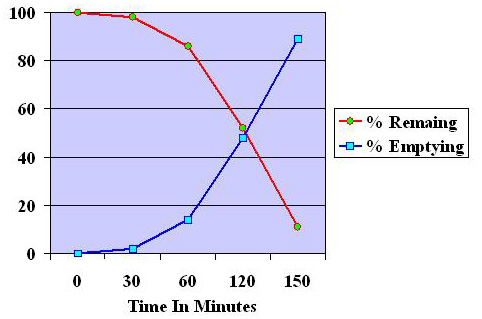
- Also time activity curves can be drawn, which is also seen above
Example of Gastric Emptying Calculations
Review the calculations below you will see them again
|
Times and decay factors |
Anterior cts |
√Ant x Post |
Current Time x100 |
% Remaining |
% Emptied |
|
Posterior cts |
|||||
|
0 Minutes (df 1.000) |
A = 31.0 k |
√1553 k/1.0 |
39.4/39.4 x 100 |
100 |
0 |
|
P = 50.1 k |
|||||
|
30 Minutes (df 0.944) |
A =31.5 k |
√1499 k/0.944 |
40.1/39.4 x 100 |
104 |
0 |
|
P =47.6 k |
|||||
|
60 Minutes (df 0.891) |
A = 44.7 k |
√1153 k/0.891 |
38.1/39.4 x 100 |
96 |
4 |
|
P = 25.8 k |
|||||
|
120 Minutes (df 0.794) |
P =10.7 k |
√266 k/0.794 |
20.5 k/39.4 x100 |
52 |
48 |
|
A = 24.9 k |
|||||
|
150 Minutes (df 0.750) |
P =1.8 k |
√10.8 k/ 0.750 |
4.3 /39.4 x 100 |
11 |
89 |
|
A = 5.7 k |
- Liquid emptying can be accomplished with In-111 DTPA in solution
- Liquid and solid emptying can be done with Tc99mSulfur Colloid attached to a solid and In-111 DTPA mixed in liquid as a dual isotope procedure
- Type of meal
- Klingensmith (2008) 1 - Comparing emptying times by given a patient a complex meal [ 3 egg whites, 2 pieces of toast, butter, salt and pepper] vs. oatmeal, it concluded that there was no difference in the emptying time. In addition, ANT and LAO images were compared for the overlap of colon and/or jejunum. While interference colon/jejunum activity was noted. The percentage of overlap was less with the LAO projection (small population)
- Zimmerman (2009) 2 - From 30 health subjects a normal liquid emptying time was determined to have an upper normal range of 22/30 minutes 2/3SD). Three-hundred mL of Water labeled with 0.2 uCi 111In was administered. Solid phase meal consisted of an egg substitute sandwich and data was acquired for 4 hours. Results indicated that 32% of patients had delayed liquid emptying while only 16% had delayed emptying with solid food (large population)
- Zimmerman (2004) 3 - Solid phase GES was acquired for 90 minutes on health volunteers. The sets of images that where taken: ANT/POST, LAO/RPO, RAO/LPO and the geometric mean was applied. While there was high correlations between the different set of projections, the ANT/POST was considered to have the best results. Furthermore, geometric mean assisted in its ability to compensate for attenuation (small population)
- Ziessman (2007) 4 - In a large study patients ingested a radioactive egg sandwich and then imaged every 10 minutes for 1 hour, 2, 3, and 4 hours. Abnormal emptying was seen in 20% of patients @ 2 hours, but 26% where abnormal @ 4 hours. In addition, lag phase was not considered a factor in identifying patients with abnormal emptying
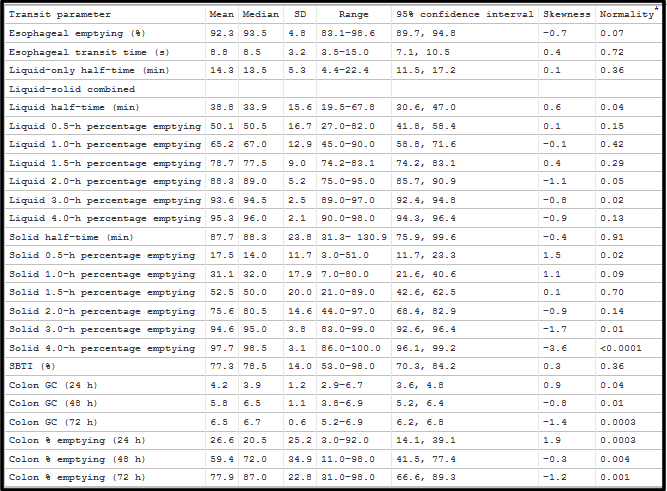
- Antonious AJ (2015) - Extensive report on different types of transit times through the GI track